02 / kepler.gldeck.gl · MapLibre · React
kepler.glExplore the viewer ↗
Visual analytics · Mobility and operations
Give density a shape.
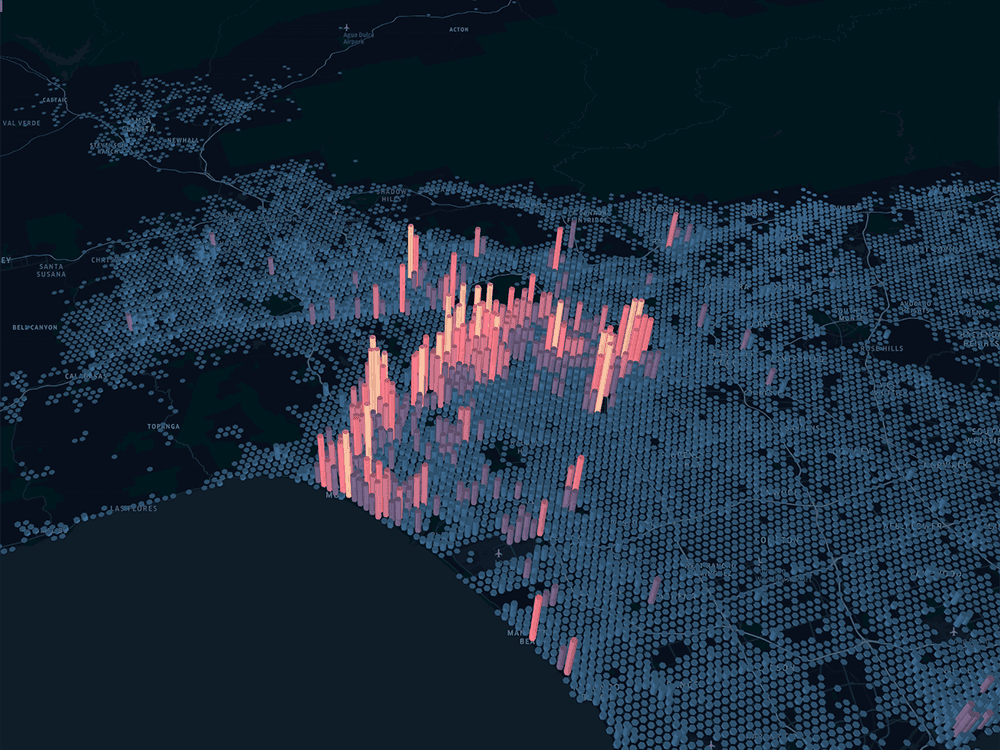
Hexagons, arcs and time filters turn geographic datasets into patterns people can explore.
- The design decision
- Height and color reveal concentrations. Filters connect the visualization to an analytical question.
- How to apply it to your platform
- A reference for trips, commercial coverage and asset distribution. Define aggregation and the legend before choosing 3D.
MIT software. Basemaps, providers and data have separate terms; the viewer license does not automatically cover them.
kepler.gl · GitHub ↗