
Public health in Medellín
Explore 10 epidemiological series by area: dengue, hepatitis A, suicide attempts, mortality, natality, mumps, whooping cough, tuberculosis, chickenpox and gender-based violence, from 2008 to 2022 depending on the event. Annual maps with counts and rates per 100,000 inhabitants: 5,808 values published by the Health Secretariat.
Explore these layers ↗Reference epidemiological surveillance retrieved in September 2026: SIVIGILA notifications with probable or confirmed diagnosis. All 10 series end in 2022 although the layers are titled “vigente”; no dates or reuse license are published. Code 99 aggregates cases with no assigned territory in a minimal polygon in La Candelaria. Aggregated reference by area, not diagnosis or individual risk.
GeoSAT · Public mapping
One city. Many ways to read it.
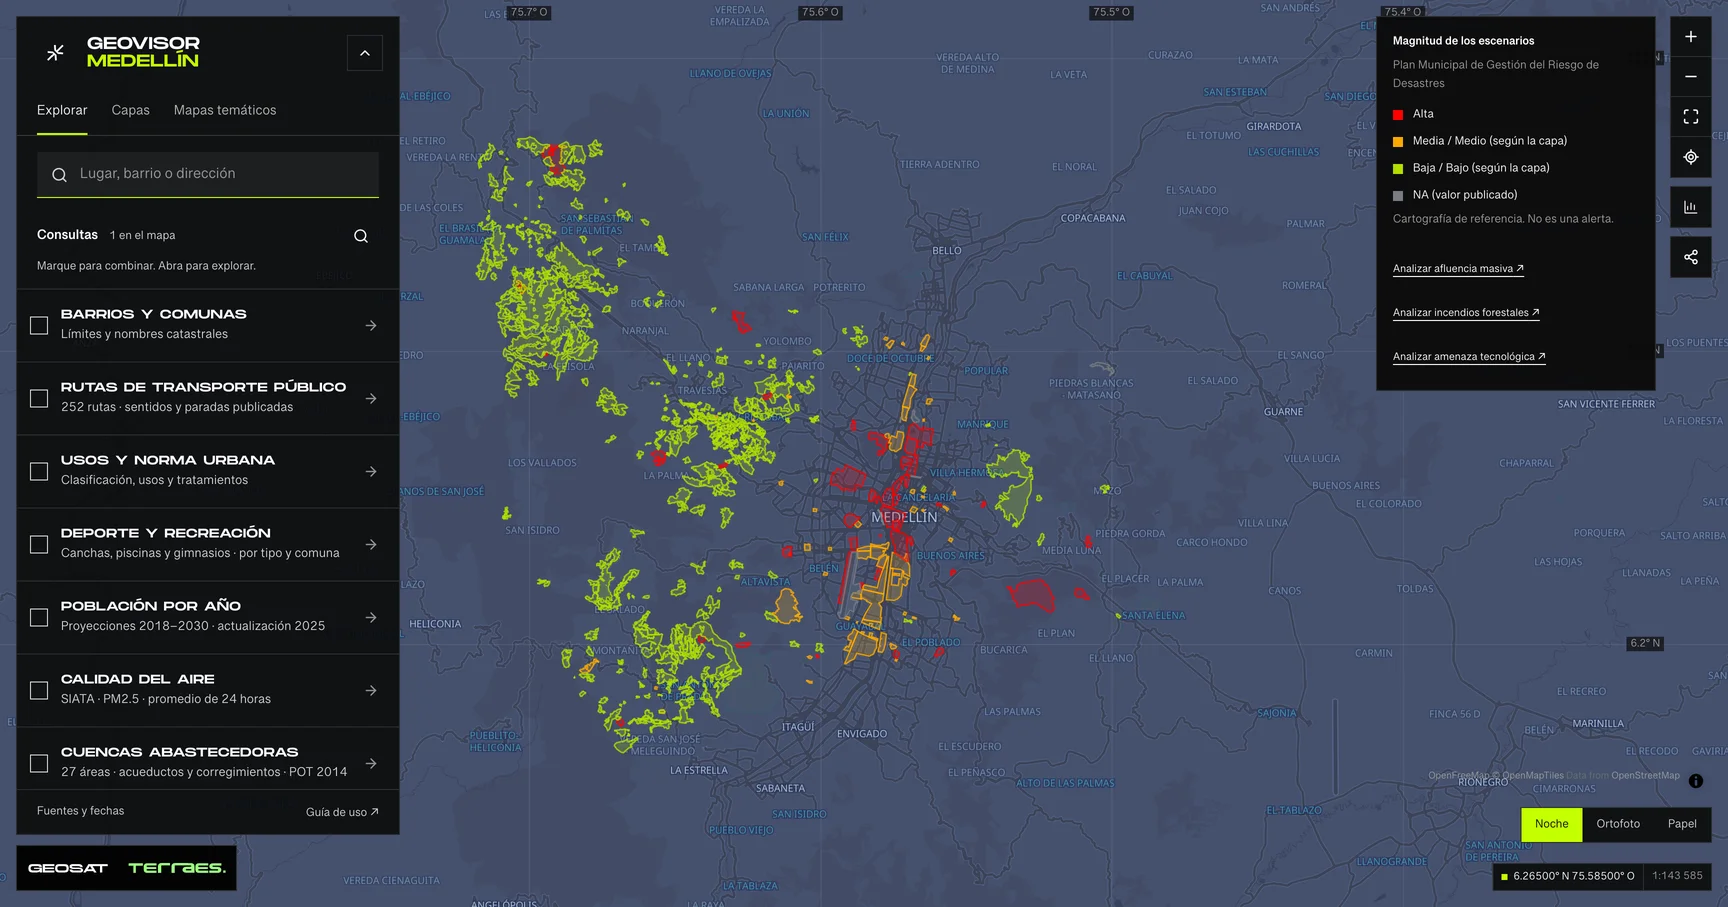
Geovisor view · Municipal Disaster Risk Management Plan scenarios, City of Medellín. Reference mapping: not alerts or events.
How to use itHow to use the map
- Open the prepared query for this theme in the viewer. Search a neighborhood or enter coordinates as latitude, longitude.
- Review enabled layers in the theme and zoom in. Detailed layers require a close scale to keep queries bounded.
- Select a feature on the map or in the Results list. Check its attributes, retrieval time and any partial-result notice.
- Choose a field and exact value to filter the layer. Export includes received results, with attribution and dates. Its coverage depends on the query scope and filters.
Frequently asked questions
What does Public health include in the Medellín geovisor?
In Medellín’s Public health you can explore 10 layers: Dengue · 2008–2022 series, Hepatitis A · 2008–2022 series, Suicide attempts · 2013–2022 series and 7 more. Each layer states its source, date and use limits.
Can I reuse the Public health data?
According to each layer’s published license: Cartografía pública municipal · licencia específica no indicada. Check the exact license on the layer record before reuse.
How current are the Public health data?
No dataset-wide date has been verified for these layers; check each source’s limits. Last GeoSAT verification: 2026-09-29.
How do I explore Public health in the viewer?
Click “Explore these layers” to open the prepared Public health query; review enabled layers under Layers. Filter by exact field and value, select features to read their records, and export received results with attribution and dates.
Who publishes the Public health data?
Layers come from Distrito Especial de Ciencia Tecnología e Innovación de Medellín · GeoMedellín · Secretaría de Salud · Adaptación GeoSAT: selección de la serie anual y consulta WGS84 al servicio de origen. Geometrías simplificadas hasta 1 m para visualización, con variación de área inferior al 1 % por registro, retrieved and adapted by GeoSAT with per-record attribution and provenance.
Which other themes can I explore?
Other themes in the Medellín geovisor: Metro, cableways and tram, Road infrastructure and taxi stands, and Walking and tactical urbanism.
Sources, dates and limits
Each source’s verification date appears in the table. Retrieval time is not the data update date. Small city-wide layers use the full extent; larger layers depend on the visible area. Reference publications retain their original retrieval date. Each page contains up to 500 features: up to 2 MiB for external services and 4 MiB for local publications. Reference publications load matching pages, up to 5,000 features and 8 MiB per query. External services may return partial samples, identified in the viewer.
| Layer and source | Data date | Reuse |
|---|---|---|
| Dengue · 2008–2022 seriesDistrito Especial de Ciencia Tecnología e Innovación de Medellín · GeoMedellín · Secretaría de Salud · Adaptación GeoSAT: selección de la serie anual y consulta WGS84 al servicio de origen. Geometrías simplificadas hasta 1 m para visualización, con variación de área inferior al 1 % por registro 22 areas (16 urban districts, 5 rural districts and code 99, “Sin información de comuna o corregimiento”) with annual cases and rates for dengue from 2008 to 2022: 660 values, all present. In 2022 the service publishes 223 cases, of which 69 have no assigned territory and are aggregated in a minimal polygon in La Candelaria. Cases are SIVIGILA notifications with probable or confirmed diagnosis; rates are per 100,000 inhabitants per the evolution-service documentation, whose values are identical. Although the layer is titled “vigente”, the published series ends in 2022. Geometries simplified by up to 1 m, with area change below 1% per record. Reference epidemiological surveillance, not diagnosis or individual risk. Servicio de datos de enfermedades / Disease-data map service ↗ | No dataset-wide date declared; check individual recordsSource checked: | Cartografía pública municipal · licencia específica no indicada |
| Hepatitis A · 2008–2022 seriesDistrito Especial de Ciencia Tecnología e Innovación de Medellín · GeoMedellín · Secretaría de Salud · Adaptación GeoSAT: selección de la serie anual y consulta WGS84 al servicio de origen. Geometrías simplificadas hasta 1 m para visualización, con variación de área inferior al 1 % por registro 22 areas (16 urban districts, 5 rural districts and code 99, “Sin información de comuna o corregimiento”) with annual cases and rates for hepatitis a from 2008 to 2022: 660 values, all present. In 2022 the service publishes 455 cases, of which 135 have no assigned territory and are aggregated in a minimal polygon in La Candelaria. Cases are SIVIGILA notifications with probable or confirmed diagnosis; rates are per 100,000 inhabitants per the evolution-service documentation, whose values are identical. Although the layer is titled “vigente”, the published series ends in 2022. Geometries simplified by up to 1 m, with area change below 1% per record. Reference epidemiological surveillance, not diagnosis or individual risk. Servicio de datos de enfermedades / Disease-data map service ↗ | No dataset-wide date declared; check individual recordsSource checked: | Cartografía pública municipal · licencia específica no indicada |
| Suicide attempts · 2013–2022 seriesDistrito Especial de Ciencia Tecnología e Innovación de Medellín · GeoMedellín · Secretaría de Salud · Adaptación GeoSAT: selección de la serie anual y consulta WGS84 al servicio de origen. Geometrías simplificadas hasta 1 m para visualización, con variación de área inferior al 1 % por registro 22 areas (16 urban districts, 5 rural districts and code 99, “Sin información de comuna o corregimiento”) with annual cases and rates for suicide attempts from 2013 to 2022: 440 values, all present. In 2022 the service publishes 2,609 cases, of which 485 have no assigned territory and are aggregated in a minimal polygon in La Candelaria. Cases are SIVIGILA notifications with probable or confirmed diagnosis; rates are per 100,000 inhabitants per the evolution-service documentation, whose values are identical. Although the layer is titled “vigente”, the published series ends in 2022. Geometries simplified by up to 1 m, with area change below 1% per record. Reference epidemiological surveillance, not diagnosis or individual risk. Servicio de datos de enfermedades / Disease-data map service ↗ | No dataset-wide date declared; check individual recordsSource checked: | Cartografía pública municipal · licencia específica no indicada |
| Mortality · 2012–2022 seriesDistrito Especial de Ciencia Tecnología e Innovación de Medellín · GeoMedellín · Secretaría de Salud · Adaptación GeoSAT: selección de la serie anual y consulta WGS84 al servicio de origen. Geometrías simplificadas hasta 1 m para visualización, con variación de área inferior al 1 % por registro 22 areas (16 urban districts, 5 rural districts and code 99, “Sin información de comuna o corregimiento”) with annual deaths and rates for mortality from 2012 to 2022: 484 values, all present. In 2022 the service publishes 16,962 deaths, of which 306 have no assigned territory and are aggregated in a minimal polygon in La Candelaria. Cases are SIVIGILA notifications with probable or confirmed diagnosis; rates are per 100,000 inhabitants per the evolution-service documentation, whose values are identical. Although the layer is titled “vigente”, the published series ends in 2022. Geometries simplified by up to 1 m, with area change below 1% per record. Reference epidemiological surveillance, not diagnosis or individual risk. Servicio de datos de enfermedades / Disease-data map service ↗ | No dataset-wide date declared; check individual recordsSource checked: | Cartografía pública municipal · licencia específica no indicada |
| Natality · 2012–2022 seriesDistrito Especial de Ciencia Tecnología e Innovación de Medellín · GeoMedellín · Secretaría de Salud · Adaptación GeoSAT: selección de la serie anual y consulta WGS84 al servicio de origen. Geometrías simplificadas hasta 1 m para visualización, con variación de área inferior al 1 % por registro 22 areas (16 urban districts, 5 rural districts and code 99, “Sin información de comuna o corregimiento”) with annual live births and rates for natality from 2012 to 2022: 484 values, all present. In 2022 the service publishes 21,658 live births, of which 116 have no assigned territory and are aggregated in a minimal polygon in La Candelaria. Cases are SIVIGILA notifications with probable or confirmed diagnosis; rates are per 100,000 inhabitants per the evolution-service documentation, whose values are identical. Although the layer is titled “vigente”, the published series ends in 2022. Geometries simplified by up to 1 m, with area change below 1% per record. Reference epidemiological surveillance, not diagnosis or individual risk. Servicio de datos de enfermedades / Disease-data map service ↗ | No dataset-wide date declared; check individual recordsSource checked: | Cartografía pública municipal · licencia específica no indicada |
| Mumps · 2008–2022 seriesDistrito Especial de Ciencia Tecnología e Innovación de Medellín · GeoMedellín · Secretaría de Salud · Adaptación GeoSAT: selección de la serie anual y consulta WGS84 al servicio de origen. Geometrías simplificadas hasta 1 m para visualización, con variación de área inferior al 1 % por registro 22 areas (16 urban districts, 5 rural districts and code 99, “Sin información de comuna o corregimiento”) with annual cases and rates for mumps from 2008 to 2022: 660 values, all present. In 2022 the service publishes 487 cases, of which 122 have no assigned territory and are aggregated in a minimal polygon in La Candelaria. Cases are SIVIGILA notifications with probable or confirmed diagnosis; rates are per 100,000 inhabitants per the evolution-service documentation, whose values are identical. Although the layer is titled “vigente”, the published series ends in 2022. Geometries simplified by up to 1 m, with area change below 1% per record. Reference epidemiological surveillance, not diagnosis or individual risk. Servicio de datos de enfermedades / Disease-data map service ↗ | No dataset-wide date declared; check individual recordsSource checked: | Cartografía pública municipal · licencia específica no indicada |
| Whooping cough · 2008–2022 seriesDistrito Especial de Ciencia Tecnología e Innovación de Medellín · GeoMedellín · Secretaría de Salud · Adaptación GeoSAT: selección de la serie anual y consulta WGS84 al servicio de origen. Geometrías simplificadas hasta 1 m para visualización, con variación de área inferior al 1 % por registro 22 areas (16 urban districts, 5 rural districts and code 99, “Sin información de comuna o corregimiento”) with annual cases and rates for whooping cough from 2008 to 2022: 660 values, all present. In 2022 the service publishes 6 cases, of which 2 have no assigned territory and are aggregated in a minimal polygon in La Candelaria. Cases are SIVIGILA notifications with probable or confirmed diagnosis; rates are per 100,000 inhabitants per the evolution-service documentation, whose values are identical. Although the layer is titled “vigente”, the published series ends in 2022. Geometries simplified by up to 1 m, with area change below 1% per record. Reference epidemiological surveillance, not diagnosis or individual risk. Servicio de datos de enfermedades / Disease-data map service ↗ | No dataset-wide date declared; check individual recordsSource checked: | Cartografía pública municipal · licencia específica no indicada |
| Pulmonary tuberculosis · 2008–2022 seriesDistrito Especial de Ciencia Tecnología e Innovación de Medellín · GeoMedellín · Secretaría de Salud · Adaptación GeoSAT: selección de la serie anual y consulta WGS84 al servicio de origen. Geometrías simplificadas hasta 1 m para visualización, con variación de área inferior al 1 % por registro 22 areas (16 urban districts, 5 rural districts and code 99, “Sin información de comuna o corregimiento”) with annual cases and rates for pulmonary tuberculosis from 2008 to 2022: 660 values, all present. In 2022 the service publishes 1,725 cases, of which 475 have no assigned territory and are aggregated in a minimal polygon in La Candelaria. Cases are SIVIGILA notifications with probable or confirmed diagnosis; rates are per 100,000 inhabitants per the evolution-service documentation, whose values are identical. Although the layer is titled “vigente”, the published series ends in 2022. Geometries simplified by up to 1 m, with area change below 1% per record. Reference epidemiological surveillance, not diagnosis or individual risk. Servicio de datos de enfermedades / Disease-data map service ↗ | No dataset-wide date declared; check individual recordsSource checked: | Cartografía pública municipal · licencia específica no indicada |
| Chickenpox · 2008–2022 seriesDistrito Especial de Ciencia Tecnología e Innovación de Medellín · GeoMedellín · Secretaría de Salud · Adaptación GeoSAT: selección de la serie anual y consulta WGS84 al servicio de origen. Geometrías simplificadas hasta 1 m para visualización, con variación de área inferior al 1 % por registro 22 areas (16 urban districts, 5 rural districts and code 99, “Sin información de comuna o corregimiento”) with annual cases and rates for chickenpox from 2008 to 2022: 660 values, all present. In 2022 the service publishes 1,191 cases, of which 319 have no assigned territory and are aggregated in a minimal polygon in La Candelaria. Cases are SIVIGILA notifications with probable or confirmed diagnosis; rates are per 100,000 inhabitants per the evolution-service documentation, whose values are identical. Although the layer is titled “vigente”, the published series ends in 2022. Geometries simplified by up to 1 m, with area change below 1% per record. Reference epidemiological surveillance, not diagnosis or individual risk. Servicio de datos de enfermedades / Disease-data map service ↗ | No dataset-wide date declared; check individual recordsSource checked: | Cartografía pública municipal · licencia específica no indicada |
| Gender-based violence · 2013–2022 seriesDistrito Especial de Ciencia Tecnología e Innovación de Medellín · GeoMedellín · Secretaría de Salud · Adaptación GeoSAT: selección de la serie anual y consulta WGS84 al servicio de origen. Geometrías simplificadas hasta 1 m para visualización, con variación de área inferior al 1 % por registro 22 areas (16 urban districts, 5 rural districts and code 99, “Sin información de comuna o corregimiento”) with annual cases and rates for gender-based violence from 2013 to 2022: 440 values, all present. In 2022 the service publishes 13,772 cases, of which 2,263 have no assigned territory and are aggregated in a minimal polygon in La Candelaria. Cases are SIVIGILA notifications with probable or confirmed diagnosis; rates are per 100,000 inhabitants per the evolution-service documentation, whose values are identical. Although the layer is titled “vigente”, the published series ends in 2022. Geometries simplified by up to 1 m, with area change below 1% per record. Reference epidemiological surveillance, not diagnosis or individual risk. Servicio de datos de enfermedades / Disease-data map service ↗ | No dataset-wide date declared; check individual recordsSource checked: | Cartografía pública municipal · licencia específica no indicada |
Display transformations and adaptations are described for each source; precision and methods differ between sources. Obtain official mapping if you need surveying accuracy or documents with administrative validity.