
Rainfall · SIATA in Medellín
Explore accumulated rainfall at SIATA stations within the Medellín map extent and neighboring municipalities. Compare seven periods, from the last five minutes to thirty days, locate each station and inspect its update time. The map uses a millimeter scale that stays the same when changing periods. Select a station to explore its time series by rain gauge, in windows from 3 hours to 30 days, with a table and CSV download.
Explore these layers ↗Station accumulations, not intensity in mm/h, forecasts, radar or emergency alerts. Operational data subject to SIATA validation. Windows end at each station’s published time and may overlap; do not sum across periods or stations. Series show each rain gauge separately with published values: zero is a dry interval and breaks mark missing data. Future intervals published by the service are omitted. Queries refresh every five minutes while visible. Gray marks a reading with no valid date or value, or an update older than 30 minutes under GeoSAT’s freshness criterion. Points do not describe rainfall uniformly across a neighborhood.
GeoSAT · Public mapping
One city. Many ways to read it.
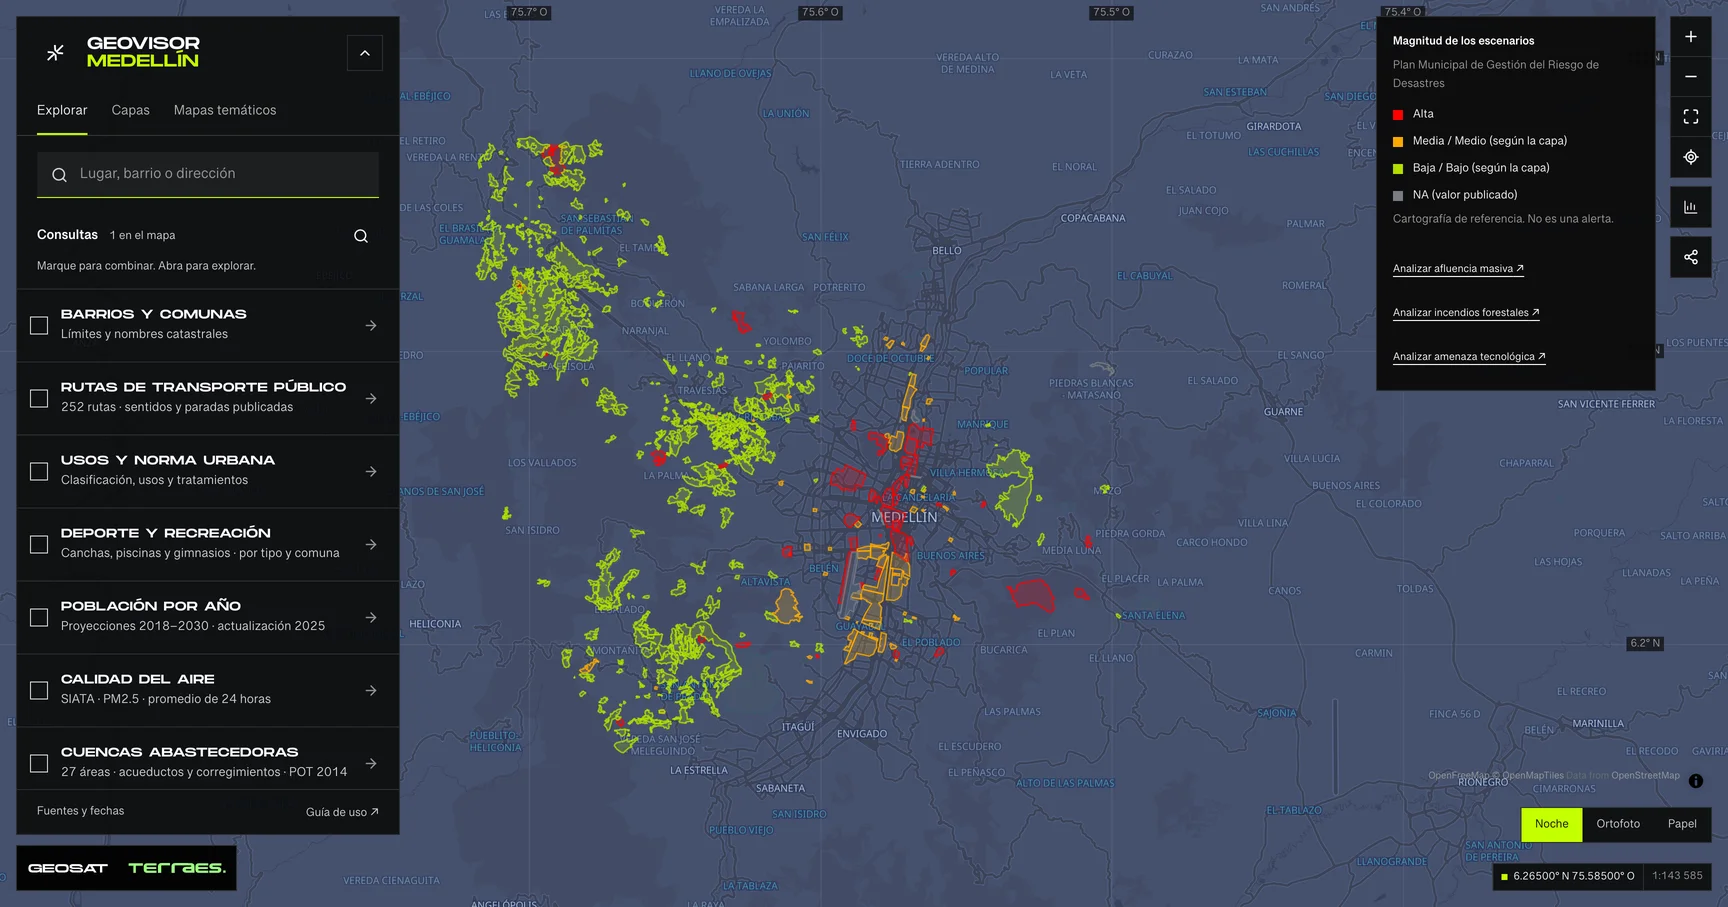
Geovisor view · Municipal Disaster Risk Management Plan scenarios, City of Medellín. Reference mapping: not alerts or events.
How to use itHow to use the map
- Open the prepared query for this theme in the viewer. Search a neighborhood or enter coordinates as latitude, longitude.
- Review enabled layers in the theme and zoom in. Detailed layers require a close scale to keep queries bounded.
- Select a feature on the map or in the Results list. Check its attributes, retrieval time and any partial-result notice.
- Select a feature in Results and inspect its attributes and source. Export contains only received results, with attribution and dates; coverage depends on the queried scope and partial-result notices.
Frequently asked questions
What does Rainfall · SIATA include in the Medellín geovisor?
In Medellín’s Rainfall · SIATA you can explore 1 layer: Accumulated rainfall · SIATA stations. Each layer states its source, date and use limits.
Can I reuse the Rainfall · SIATA data?
According to each layer’s published license: Publicación ambiental pública · licencia específica no indicada. Check the exact license on the layer record before reuse.
How current are the Rainfall · SIATA data?
No dataset-wide date has been verified for these layers; check each source’s limits. Last GeoSAT verification: 2026-09-27.
How do I explore Rainfall · SIATA in the viewer?
Click “Explore these layers” to open the prepared Rainfall · SIATA query; review enabled layers under Layers. Filter by exact field and value, select features to read their records, and export received results with attribution and dates.
Who publishes the Rainfall · SIATA data?
Layers come from SIATA · Área Metropolitana del Valle de Aburrá · GeoSAT: normalización de la red pluviométrica pública, retrieved and adapted by GeoSAT with per-record attribution and provenance.
Which other themes can I explore?
Other themes in the Medellín geovisor: Metro, cableways and tram, Road infrastructure and taxi stands, and Walking and tactical urbanism.
Sources, dates and limits
Each source’s verification date appears in the table. Retrieval time is not the data update date. Small city-wide layers use the full extent; larger layers depend on the visible area. Reference publications retain their original retrieval date. Each page contains up to 500 features: up to 2 MiB for external services and 4 MiB for local publications. Reference publications load matching pages, up to 5,000 features and 8 MiB per query. External services may return partial samples, identified in the viewer.
| Layer and source | Data date | Reuse |
|---|---|---|
| Accumulated rainfall · SIATA stationsSIATA · Área Metropolitana del Valle de Aburrá · GeoSAT: normalización de la red pluviométrica pública | Update per station · inspect the recordSource checked: | Publicación ambiental pública · licencia específica no indicada |
Display transformations and adaptations are described for each source; precision and methods differ between sources. Obtain official mapping if you need surveying accuracy or documents with administrative validity.