
Infectious diseases in Medellín
6 series · cases and rates 2008–2022.
6 layers · 132 published map features · Distrito Especial de Ciencia Tecnología e Innovación de Medellín · GeoMedellín · Secretaría de Salud · Adaptación GeoSAT: selección de la serie anual y consulta WGS84 al servicio de origen. Geometrías simplificadas hasta 1 m para visualización, con variación de área inferior al 1 % por registro
Open this query ↗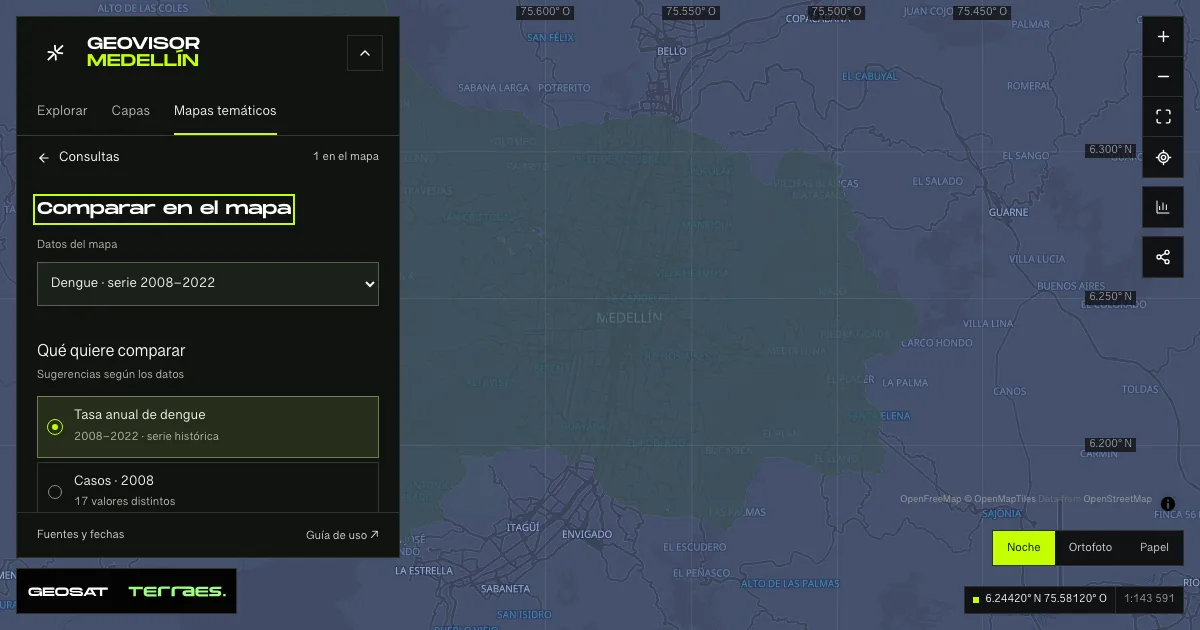
What it includes
- Dengue · 2008–2022 series
22 map features · date not declared · Cartografía pública municipal · licencia específica no indicada
Distrito Especial de Ciencia Tecnología e Innovación de Medellín · GeoMedellín · Secretaría de Salud · Adaptación GeoSAT: selección de la serie anual y consulta WGS84 al servicio de origen. Geometrías simplificadas hasta 1 m para visualización, con variación de área inferior al 1 % por registro · Source checked: 2026-09-29
22 areas (16 urban districts, 5 rural districts and code 99, “Sin información de comuna o corregimiento”) with annual cases and rates for dengue from 2008 to 2022: 660 values, all present. In 2022 the service publishes 223 cases, of which 69 have no assigned territory and are aggregated in a minimal polygon in La Candelaria. Cases are SIVIGILA notifications with probable or confirmed diagnosis; rates are per 100,000 inhabitants per the evolution-service documentation, whose values are identical. Although the layer is titled “vigente”, the published series ends in 2022. Geometries simplified by up to 1 m, with area change below 1% per record. Reference epidemiological surveillance, not diagnosis or individual risk.
Official source ↗Servicio de datos de enfermedades / Disease-data map service ↗
- Hepatitis A · 2008–2022 series
22 map features · date not declared · Cartografía pública municipal · licencia específica no indicada
Distrito Especial de Ciencia Tecnología e Innovación de Medellín · GeoMedellín · Secretaría de Salud · Adaptación GeoSAT: selección de la serie anual y consulta WGS84 al servicio de origen. Geometrías simplificadas hasta 1 m para visualización, con variación de área inferior al 1 % por registro · Source checked: 2026-09-29
22 areas (16 urban districts, 5 rural districts and code 99, “Sin información de comuna o corregimiento”) with annual cases and rates for hepatitis a from 2008 to 2022: 660 values, all present. In 2022 the service publishes 455 cases, of which 135 have no assigned territory and are aggregated in a minimal polygon in La Candelaria. Cases are SIVIGILA notifications with probable or confirmed diagnosis; rates are per 100,000 inhabitants per the evolution-service documentation, whose values are identical. Although the layer is titled “vigente”, the published series ends in 2022. Geometries simplified by up to 1 m, with area change below 1% per record. Reference epidemiological surveillance, not diagnosis or individual risk.
Official source ↗Servicio de datos de enfermedades / Disease-data map service ↗
- Mumps · 2008–2022 series
22 map features · date not declared · Cartografía pública municipal · licencia específica no indicada
Distrito Especial de Ciencia Tecnología e Innovación de Medellín · GeoMedellín · Secretaría de Salud · Adaptación GeoSAT: selección de la serie anual y consulta WGS84 al servicio de origen. Geometrías simplificadas hasta 1 m para visualización, con variación de área inferior al 1 % por registro · Source checked: 2026-09-29
22 areas (16 urban districts, 5 rural districts and code 99, “Sin información de comuna o corregimiento”) with annual cases and rates for mumps from 2008 to 2022: 660 values, all present. In 2022 the service publishes 487 cases, of which 122 have no assigned territory and are aggregated in a minimal polygon in La Candelaria. Cases are SIVIGILA notifications with probable or confirmed diagnosis; rates are per 100,000 inhabitants per the evolution-service documentation, whose values are identical. Although the layer is titled “vigente”, the published series ends in 2022. Geometries simplified by up to 1 m, with area change below 1% per record. Reference epidemiological surveillance, not diagnosis or individual risk.
Official source ↗Servicio de datos de enfermedades / Disease-data map service ↗
- Whooping cough · 2008–2022 series
22 map features · date not declared · Cartografía pública municipal · licencia específica no indicada
Distrito Especial de Ciencia Tecnología e Innovación de Medellín · GeoMedellín · Secretaría de Salud · Adaptación GeoSAT: selección de la serie anual y consulta WGS84 al servicio de origen. Geometrías simplificadas hasta 1 m para visualización, con variación de área inferior al 1 % por registro · Source checked: 2026-09-29
22 areas (16 urban districts, 5 rural districts and code 99, “Sin información de comuna o corregimiento”) with annual cases and rates for whooping cough from 2008 to 2022: 660 values, all present. In 2022 the service publishes 6 cases, of which 2 have no assigned territory and are aggregated in a minimal polygon in La Candelaria. Cases are SIVIGILA notifications with probable or confirmed diagnosis; rates are per 100,000 inhabitants per the evolution-service documentation, whose values are identical. Although the layer is titled “vigente”, the published series ends in 2022. Geometries simplified by up to 1 m, with area change below 1% per record. Reference epidemiological surveillance, not diagnosis or individual risk.
Official source ↗Servicio de datos de enfermedades / Disease-data map service ↗
- Pulmonary tuberculosis · 2008–2022 series
22 map features · date not declared · Cartografía pública municipal · licencia específica no indicada
Distrito Especial de Ciencia Tecnología e Innovación de Medellín · GeoMedellín · Secretaría de Salud · Adaptación GeoSAT: selección de la serie anual y consulta WGS84 al servicio de origen. Geometrías simplificadas hasta 1 m para visualización, con variación de área inferior al 1 % por registro · Source checked: 2026-09-29
22 areas (16 urban districts, 5 rural districts and code 99, “Sin información de comuna o corregimiento”) with annual cases and rates for pulmonary tuberculosis from 2008 to 2022: 660 values, all present. In 2022 the service publishes 1,725 cases, of which 475 have no assigned territory and are aggregated in a minimal polygon in La Candelaria. Cases are SIVIGILA notifications with probable or confirmed diagnosis; rates are per 100,000 inhabitants per the evolution-service documentation, whose values are identical. Although the layer is titled “vigente”, the published series ends in 2022. Geometries simplified by up to 1 m, with area change below 1% per record. Reference epidemiological surveillance, not diagnosis or individual risk.
Official source ↗Servicio de datos de enfermedades / Disease-data map service ↗
- Chickenpox · 2008–2022 series
22 map features · date not declared · Cartografía pública municipal · licencia específica no indicada
Distrito Especial de Ciencia Tecnología e Innovación de Medellín · GeoMedellín · Secretaría de Salud · Adaptación GeoSAT: selección de la serie anual y consulta WGS84 al servicio de origen. Geometrías simplificadas hasta 1 m para visualización, con variación de área inferior al 1 % por registro · Source checked: 2026-09-29
22 areas (16 urban districts, 5 rural districts and code 99, “Sin información de comuna o corregimiento”) with annual cases and rates for chickenpox from 2008 to 2022: 660 values, all present. In 2022 the service publishes 1,191 cases, of which 319 have no assigned territory and are aggregated in a minimal polygon in La Candelaria. Cases are SIVIGILA notifications with probable or confirmed diagnosis; rates are per 100,000 inhabitants per the evolution-service documentation, whose values are identical. Although the layer is titled “vigente”, the published series ends in 2022. Geometries simplified by up to 1 m, with area change below 1% per record. Reference epidemiological surveillance, not diagnosis or individual risk.
Official source ↗Servicio de datos de enfermedades / Disease-data map service ↗
How to use it
- Click “Open this query” to load Dengue · 2008–2022 series, Hepatitis A · 2008–2022 series, Mumps · 2008–2022 series, Whooping cough · 2008–2022 series, Pulmonary tuberculosis · 2008–2022 series, and Chickenpox · 2008–2022 series in the viewer.
- Select a feature on the map or in the Results list to read its record with attributes, source and date.
- Change the year with the time control. Open Thematic maps to inspect the trend and annual values table; review the comparability notes.
- Share the view link or export received results with attribution and dates.
Read epidemiological series by area →
Frequently asked questions
What does “Infectious diseases” open on the map?
6 series · cases and rates 2008–2022: 6 layers (Dengue · 2008–2022 series, Hepatitis A · 2008–2022 series, Mumps · 2008–2022 series, Whooping cough · 2008–2022 series, Pulmonary tuberculosis · 2008–2022 series, and Chickenpox · 2008–2022 series), with 132 published map features.
Where do the data come from, and how can they be reused?
Layers come from Distrito Especial de Ciencia Tecnología e Innovación de Medellín · GeoMedellín · Secretaría de Salud · Adaptación GeoSAT: selección de la serie anual y consulta WGS84 al servicio de origen. Geometrías simplificadas hasta 1 m para visualización, con variación de área inferior al 1 % por registro. Published licenses: Cartografía pública municipal · licencia específica no indicada. Each record retains its source and date; check the exact license before reuse.
Are the results complete?
This query loads 6 layers from reference publications by pages within the queried area, up to 5,000 map features and 8 MiB per layer. Wait for loading to finish before interpreting statistics; zoom in if the limit is exceeded. The queried area is not the complete municipal inventory.
Do I need an account or payment?
No. The Medellín geovisor is free with no account: open the query, explore, export received results and share the link. Last GeoSAT verification: 2026-09-29.