
Population by year in Medellín
2018–2030 projections · 2025 update.
1 layer · 21 published map features · Distrito de Medellín · GeoMedellín · Departamento Administrativo de Planeación, Subdirección de Prospectiva, Información y Evaluación Estratégica · DANE, contrato 4600104690 de 2025 · Adaptación GeoSAT: suma de componentes por territorio, unión con límites de 2014 y reparación topológica de La América (variación de área menor al 0,01 %)
Open this query ↗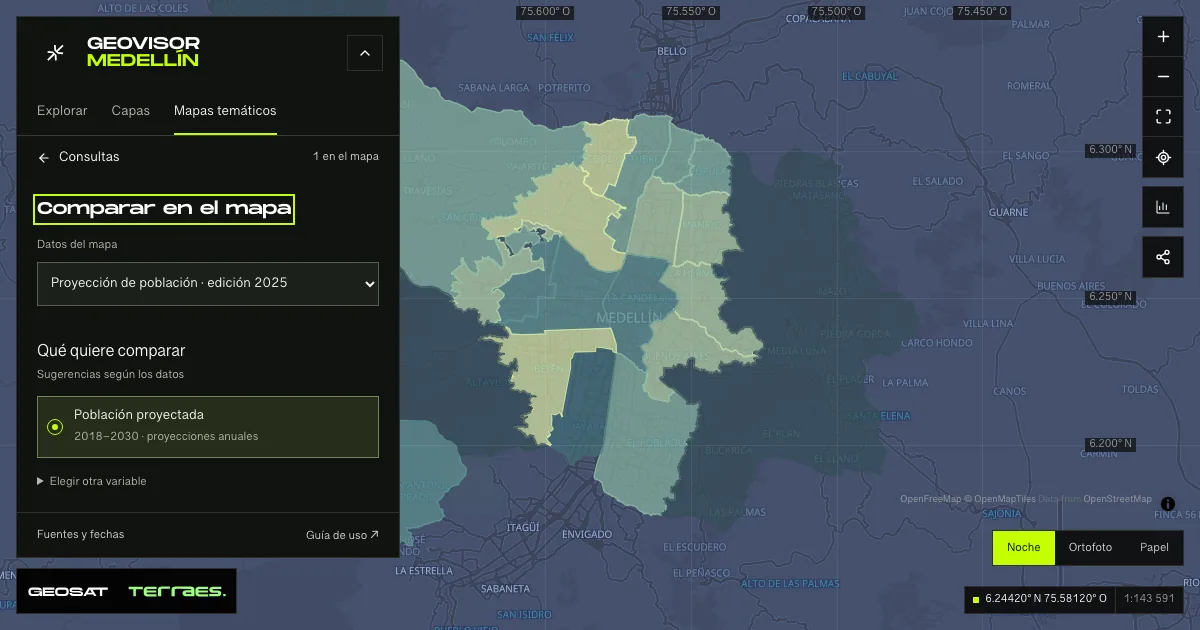
What it includes
- Population projection · 2025 release
21 map features · 2025-07-30 · CC BY-SA 4.0
Distrito de Medellín · GeoMedellín · Departamento Administrativo de Planeación, Subdirección de Prospectiva, Información y Evaluación Estratégica · DANE, contrato 4600104690 de 2025 · Adaptación GeoSAT: suma de componentes por territorio, unión con límites de 2014 y reparación topológica de La América (variación de área menor al 0,01 %) · Source checked: 2026-09-26
Official source ↗
How to use it
- Click “Open this query” to load Population projection · 2025 release in the viewer.
- Select a feature on the map or in the Results list to read its record with attributes, source and date.
- Change the year with the time control. Open Thematic maps to inspect the trend and annual values table; review the comparability notes.
- Share the view link or export received results with attribution and dates.
Frequently asked questions
What does “Population by year” open on the map?
2018–2030 projections · 2025 update: 1 layer (Population projection · 2025 release), with 21 published map features.
Where do the data come from, and how can they be reused?
Layers come from Distrito de Medellín · GeoMedellín · Departamento Administrativo de Planeación, Subdirección de Prospectiva, Información y Evaluación Estratégica · DANE, contrato 4600104690 de 2025 · Adaptación GeoSAT: suma de componentes por territorio, unión con límites de 2014 y reparación topológica de La América (variación de área menor al 0,01 %). Published licenses: CC BY-SA 4.0. Each record retains its source and date; check the exact license before reuse.
Are the results complete?
This query loads 1 layer from reference publications by pages within the queried area, up to 5,000 map features and 8 MiB per layer. Wait for loading to finish before interpreting statistics; zoom in if the limit is exceeded. The queried area is not the complete municipal inventory.
Do I need an account or payment?
No. The Medellín geovisor is free with no account: open the query, explore, export received results and share the link. Last GeoSAT verification: 2026-09-26.