
Housing density, floor-area ratio and height in Medellín
Compare three published 2014 planning variables.
1 layer · 386 published map features · Distrito Especial de Ciencia Tecnología e Innovación de Medellín · GeoMedellín · Departamento Administrativo de Planeación · Adaptación GeoSAT: atributos seleccionados; transformación WGS84 del servicio; simplificación de hasta 0,5 m con preservación de componentes y huecos; precisión de al menos siete decimales
Open this query ↗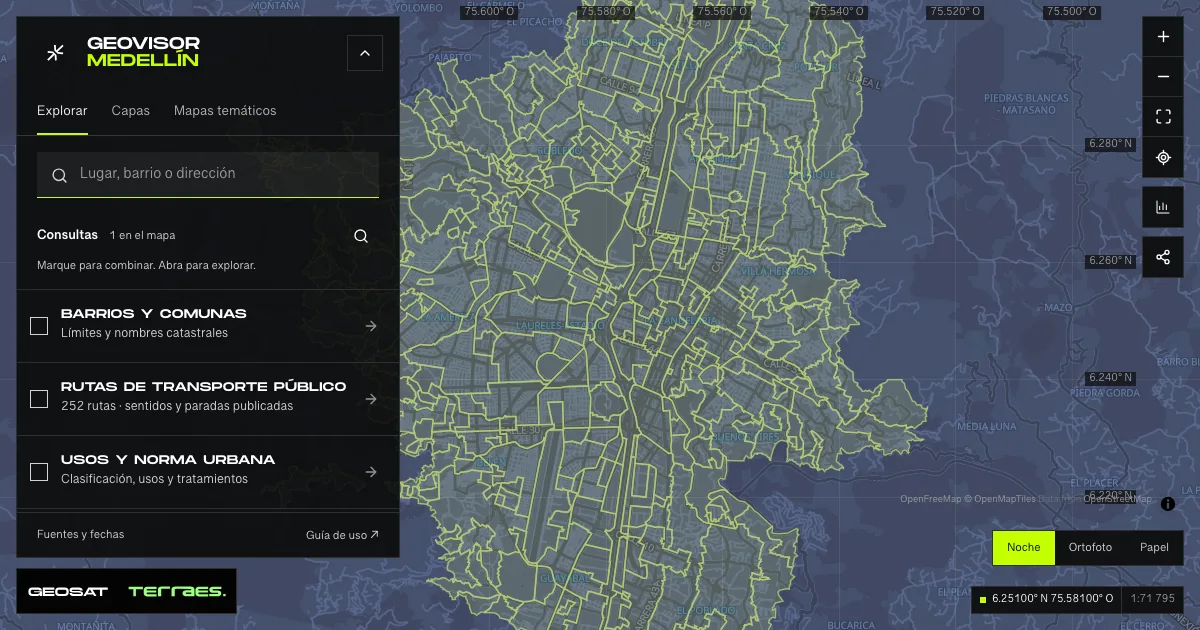
What it includes
- Housing density, floor-area ratio and height · 2014 plan
386 map features · 2014-12-17 · Cartografía pública municipal · licencia específica no indicada
Distrito Especial de Ciencia Tecnología e Innovación de Medellín · GeoMedellín · Departamento Administrativo de Planeación · Adaptación GeoSAT: atributos seleccionados; transformación WGS84 del servicio; simplificación de hasta 0,5 m con preservación de componentes y huecos; precisión de al menos siete decimales · Source checked: 2026-09-28
386 municipal urban and urban-expansion polygons, with published adoption and update dates of December 17, 2014. Density, floor-area-ratio and height services repeat the same IDs and attributes and are included once. Their scope differs from the metropolitan treatment source’s 522 records, retained separately. Maximum housing density: dwellings per hectare; floor-area ratio: permitted floor m² per land m²; both use net land area except Development treatment, which uses gross area. Numeric height is in floors. “N/A” and “Variable 1/2/3” remain categories and are not converted to zero. These are published planning parameters, not population, existing dwellings or measured building heights. Means describe polygons with values, without area weighting; they do not calculate total development capacity. Application depends on Agreement 48 of 2014 and applicable rules; the viewer does not certify a property’s development rights. The service declares no specific reuse license.
Official source ↗Densidad: leyenda / Density legend ↗
Índice de construcción / Floor-area ratio ↗
Altura normativa / Planning height ↗
Acuerdo 48 de 2014: artículos 271, 273, 280 y 295 / Adopted planning definitions ↗
How to use it
- Click “Open this query” to load Housing density, floor-area ratio and height · 2014 plan in the viewer.
- Select a feature on the map or in the Results list to read its record with attributes, source and date.
- Build a thematic map to compare, or open statistics to analyze the loaded data.
- Share the view link or export received results with attribution and dates.
Check Medellín planning maps step by step →
Frequently asked questions
What does “Housing density, floor-area ratio and height” open on the map?
Compare three published 2014 planning variables: 1 layer (Housing density, floor-area ratio and height · 2014 plan), with 386 published map features.
Where do the data come from, and how can they be reused?
Layers come from Distrito Especial de Ciencia Tecnología e Innovación de Medellín · GeoMedellín · Departamento Administrativo de Planeación · Adaptación GeoSAT: atributos seleccionados; transformación WGS84 del servicio; simplificación de hasta 0,5 m con preservación de componentes y huecos; precisión de al menos siete decimales. Published licenses: Cartografía pública municipal · licencia específica no indicada. Each record retains its source and date; check the exact license before reuse.
Are the results complete?
This query loads 1 layer from reference publications by pages within the queried area, up to 5,000 map features and 8 MiB per layer. Wait for loading to finish before interpreting statistics; zoom in if the limit is exceeded. The queried area is not the complete municipal inventory.
Do I need an account or payment?
No. The Medellín geovisor is free with no account: open the query, explore, export received results and share the link. Last GeoSAT verification: 2026-09-28.