
River and stream levels in Medellín
Curves and channel profile · SIATA.
1 layer · service queried by area · SIATA · Área Metropolitana del Valle de Aburrá · GeoSAT: selección de estaciones en la extensión del visor y normalización de fechas y series
Open this query ↗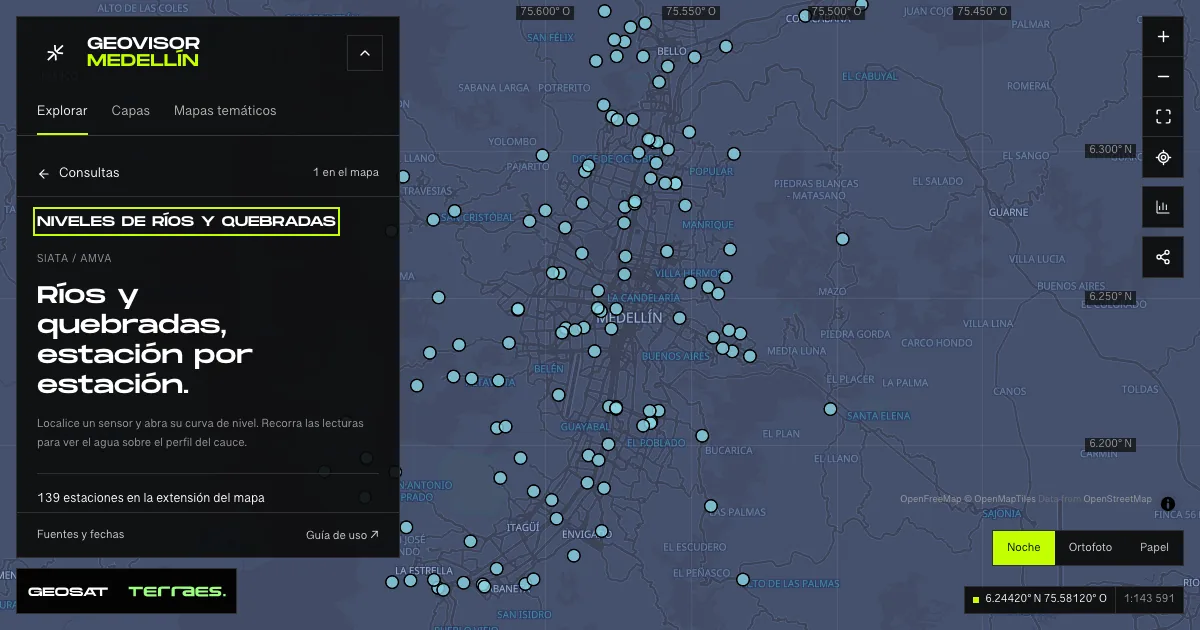
What it includes
- Water levels · SIATA stations
Queried per area · up to 500 records · date not declared · Publicación ambiental pública · licencia específica no indicada
SIATA · Área Metropolitana del Valle de Aburrá · GeoSAT: selección de estaciones en la extensión del visor y normalización de fechas y series · Source checked: 2026-09-27
Official source ↗
How to use it
- Click “Open this query” to load Water levels · SIATA stations in the viewer.
- Select a feature on the map or in the Results list to read its record with attributes, source and date.
- Build a thematic map to compare, or open statistics to analyze the loaded data.
- Share the view link or export received results with attribution and dates.
Browse river and stream water levels →
Frequently asked questions
What does “River and stream levels” open on the map?
Curves and channel profile · SIATA: 1 layer (Water levels · SIATA stations), with 1 queried live per area.
Where do the data come from, and how can they be reused?
Layers come from SIATA · Área Metropolitana del Valle de Aburrá · GeoSAT: selección de estaciones en la extensión del visor y normalización de fechas y series. Published licenses: Publicación ambiental pública · licencia específica no indicada. Each record retains its source and date; check the exact license before reuse.
Are the results complete?
This query loads 1 layer within the visible area, up to 500 records per zone: zoom in to complete a sector. A partial-result notice means you are not seeing the whole inventory.
Do I need an account or payment?
No. The Medellín geovisor is free with no account: open the query, explore, export received results and share the link. Last GeoSAT verification: 2026-09-27.