
Flood hazard in Medellín
716 polygons · four planning hazard degrees.
1 layer · 716 published map features · Distrito de Medellín · GeoMedellín · Departamento Administrativo de Planeación · Adaptación GeoSAT: atributos seleccionados, fechas UTC ISO, WGS84 y simplificación topológica hasta 1 m, conservando componentes y huecos, con variación de área inferior al 0,5 % por registro
Open this query ↗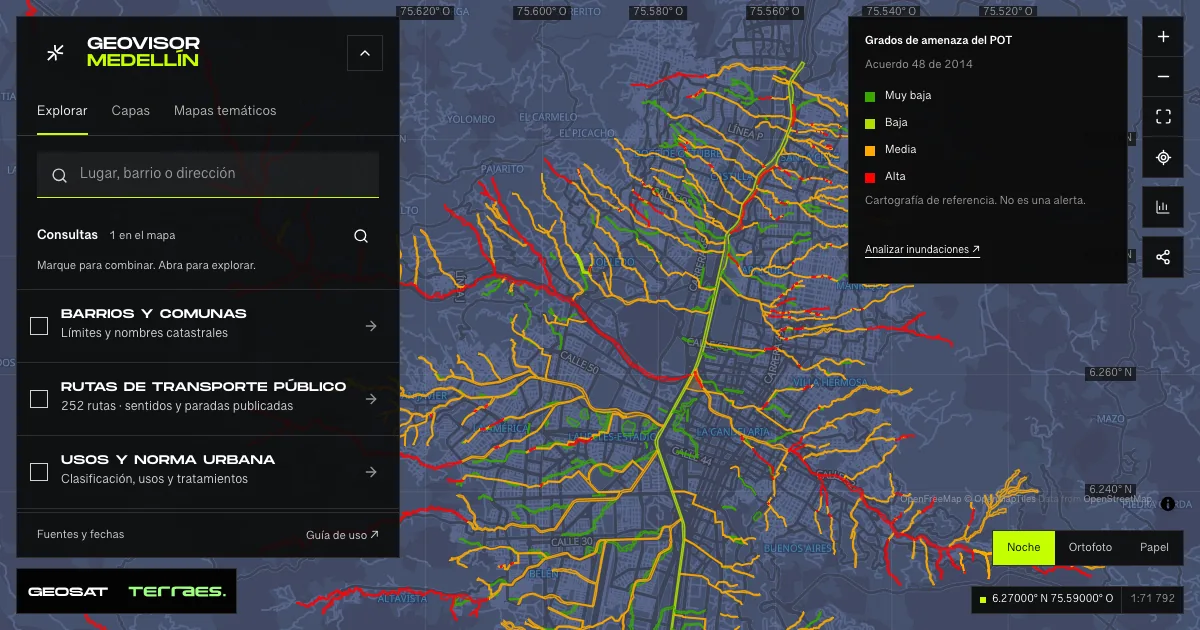
What it includes
- Flood hazard · land-use plan
716 map features · 2026-04-30 · Cartografía pública municipal · licencia específica no indicada
Distrito de Medellín · GeoMedellín · Departamento Administrativo de Planeación · Adaptación GeoSAT: atributos seleccionados, fechas UTC ISO, WGS84 y simplificación topológica hasta 1 m, conservando componentes y huecos, con variación de área inferior al 0,5 % por registro · Source checked: 2026-09-28
716 polygons: 197 very low, 123 low, 259 medium and 137 high hazard. Records state adoption on December 17, 2014 and update on April 30, 2026. These are planning hazard degrees, not observed floods, forecasts, warnings, exposed populations or property assessments. Torrent-flow hazard is not included. Consult Planning and the official adopted map for authoritative decisions. The service declares no specific reuse license.
Official source ↗
How to use it
- Click “Open this query” to load Flood hazard · land-use plan in the viewer.
- Select a feature on the map or in the Results list to read its record with attributes, source and date.
- Build a thematic map to compare, or open statistics to analyze the loaded data.
- Share the view link or export received results with attribution and dates.
Distinguish hazard and risk conditions →
Frequently asked questions
What does “Flood hazard” open on the map?
716 polygons · four planning hazard degrees: 1 layer (Flood hazard · land-use plan), with 716 published map features.
Where do the data come from, and how can they be reused?
Layers come from Distrito de Medellín · GeoMedellín · Departamento Administrativo de Planeación · Adaptación GeoSAT: atributos seleccionados, fechas UTC ISO, WGS84 y simplificación topológica hasta 1 m, conservando componentes y huecos, con variación de área inferior al 0,5 % por registro. Published licenses: Cartografía pública municipal · licencia específica no indicada. Each record retains its source and date; check the exact license before reuse.
Are the results complete?
This query loads 1 layer from reference publications by pages within the queried area, up to 5,000 map features and 8 MiB per layer. Wait for loading to finish before interpreting statistics; zoom in if the limit is exceeded. The queried area is not the complete municipal inventory.
Do I need an account or payment?
No. The Medellín geovisor is free with no account: open the query, explore, export received results and share the link. Last GeoSAT verification: 2026-09-28.