
A question before a layer
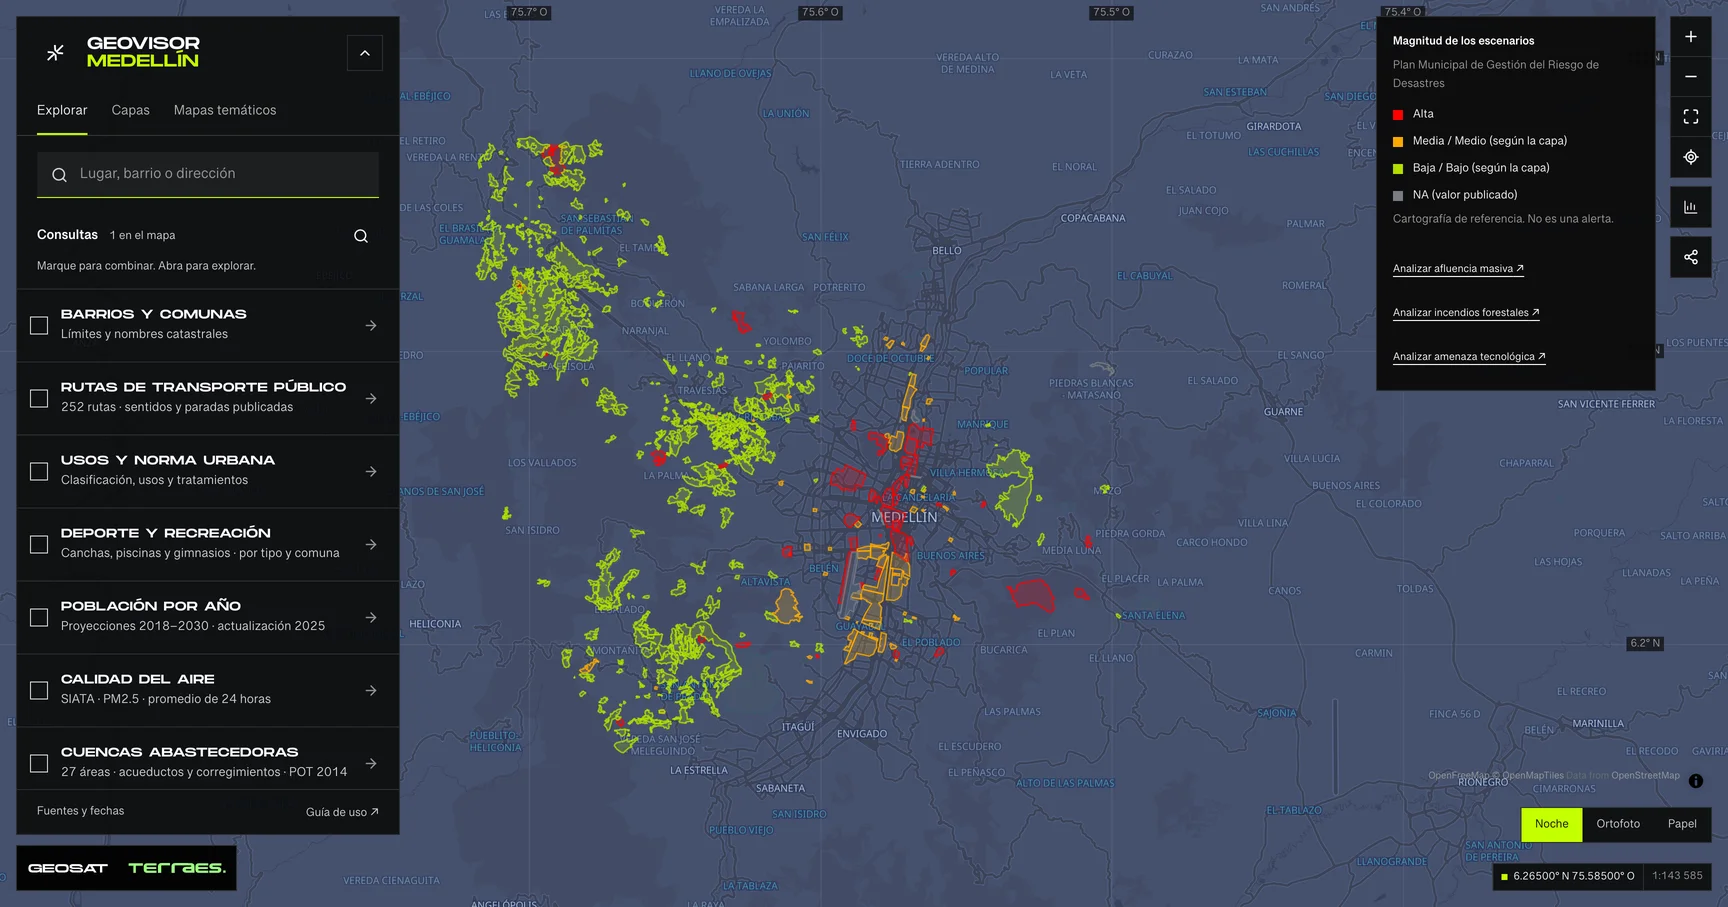
Which published land uses surround a place? How does projected population vary between districts? Which loaded facilities intersect a neighborhood? GeoSAT’s geovisor lets you explore these questions in one map, without creating an account or installing a desktop GIS.
Start with the public Medellín map. It brings together mapping from public organizations and retains each layer’s provenance. You can navigate, open records, represent variables with colors and inspect the data behind a comparison.
For a step-by-step walkthrough, open the complete geovisor guide. Keep it alongside the map while you practice in another tab.
Understand a place at several scales
An address does not tell the whole story of a territory. Neighborhood and district boundaries provide context; land classification, use and planning treatment layers add another perspective. Published hazard conditions, protected land, facilities and cadastral mapping broaden the query.
Each topic has a page describing its sources and scope. Published cadastral information does not establish market price, and a planning layer does not replace an official determination about a parcel. These distinctions matter when a map is used to prepare a site visit, guide research or discuss a location with a technical team.
For that research, read how to consult Medellín’s POT, land-use categories and map legends, including the municipal workflow and the current scope of GeoSAT’s viewer.
A click can encounter several overlapping features. The information panel lets you filter by layer and review records with previous and next controls. You do not need to guess which polygon received the click or select the place again to read the next record.
Colors should answer a question
In Thematic maps, the variable and its legend share a panel. You can distinguish categories or represent quantities with intervals. Suggested grouping considers the data distribution; you can also adjust the method and color scale.
One example is population projections by urban and rural district. The annual selector covers 2018–2030 using the release published in 2025. Intervals stay fixed between years for the loaded territories, preventing a shifting color scale from implying demographic change on its own.
These are projections, not observed counts or real-time measurements. Select a legend group to locate its territories and review the records that make up the group.
Space to analyze as well as explore
Analyze data opens a full-screen statistics workspace. Visualizations respond to the variable: categories, numeric distributions and annual series when available. You can inspect counts and summaries, select groups and return to their map records.
Scope is part of the result. A radius, published boundary or drawn polygon lets you ask about a particular area. Territory comparison uses the same variable for two areas. Calculations work on loaded geometries, and the viewer identifies partial queries.
This supports an interpretable view of the context when a report retains the scope. A count of facilities received by a query should not be presented as the city’s complete inventory. Likewise, summed areas of overlapping polygons do not equal unique covered area.
Routes you can follow on the map
The feeder route explorer organizes paths by route code and itinerary. Choosing one path dims the rest of the network. Associated stops appear on the map and in a list that opens individual records.
The source is Metro de Medellín’s open-data portal. Its metadata describes reference mapping from July 2021. The viewer does not present it as current operations: there are no animated vehicles, live traffic claims or invented arrival times. Stops are listed by name because the source does not publish their sequence.
Air quality, with a date and context
The SIATA air quality query shows population-representative PM2.5 stations in Medellín and neighboring municipalities within the viewer extent. Each point retains its mean concentration over the last 24 hours, published classification and update time. Sort stations, filter the list by classification and open individual records.
Concentrations are expressed in µg/m³; they are not ICA index values or instantaneous measurements. The viewer checks the source every five minutes while the layer is visible and identifies updates older than 30 minutes. Values are not interpolated between stations. The air quality guide explains how to interpret and compare these provisional operational readings.
Rainfall, from station to time window
The rainfall by station query switches between seven SIATA accumulations, from five minutes to thirty days. The list sorts the largest recent amounts, lets you find a station and opens its record on the map. Colors retain a fixed millimeter scale; shared links preserve the selected period.
Each accumulation ends at its station’s published time. It is not a forecast or an alert and should not be summed across stations or overlapping windows. The rainfall guide explains zeros, missing values, old updates and meaningful comparisons.
The weather by station query offers temperature, relative humidity, wind speed and air pressure. Switch variables to compare points on a fixed scale, find a station and open analysis with that same variable. The weather guide explains units, freshness and missing readings. SIATA observations are operational and subject to validation: they are not a forecast, and a station mean does not represent weather across Medellín.
A pool, a court or somewhere to train
In Sport and recreation, combine facility type and district to find places in the INDER inventory. For example, Piscina + Belén returns three records in the retrieved publication. The map, list and statistics use that same selection; a shared link preserves both filters.
The publication contains 967 records across 39 types: courts, pools, outdoor gyms and recreation spaces, as well as administrative offices. A complex can contain several records and the source declares no update date. This inventory does not confirm opening hours, condition or availability. The sports guide explains how to inspect a record and continue to INDER’s official terms and reservations.
Your files stay on your device
You can import GeoJSON, KML, GPX, CSV with coordinates and zipped Shapefiles. Files are processed in the browser without uploading them to GeoSAT. You can inspect and analyze these local layers alongside public mapping.
A shared link preserves the view and public layers, including their order and opacity. It also retains the variable, year, color scale and grouping method of an applied public thematic map. Opening it queries data again: the link does not freeze values or legend intervals. Local files, filters and selections remain in your session. To document a specific analysis, use a printout with its legend, scope and source.
A geovisor can serve your organization too
This project demonstrates geographic software built around concrete tasks: finding, comparing, inspecting and explaining. A public organization, utility or planning team may need different sources, permissions, processes and outputs.
Explore the geovisor, follow the user guide or talk to GeoSAT about your project. To learn about our territorial management platform, visit Terraes.
